Text Editing Tools
The Page Content field has many tools available for creating sections of a lab report.
Spelling and Grammar Checker
Spelling is automatically checked within the page. Errors will show with a red underline on the affected text, similar to many word processors. OCLaRE does not check grammar on its own. For this, a third-party browser extension can be installed which will read the page content and suggest edits. The button labeled “Install Grammarly” links to the website for Grammarly, a popular browser extension for checking grammar. OCLaRE does not endorse any specific third-party application. Other grammar checkers are available.
Text Formatting and Appearance


These tools control the appearance of text within a lab. Text can use different predefined formats with 6 different levels of heading in addition to normal text. Finer control over appearance uses the bold, italic and underline tools, the subscript and superscript tools, and the text colour and highlighting tools. Text alignment includes left, center, right, and justify.
Lists

Numbered and Bulleted lists are available within labs. When working with lists, the first item will appear after clicking the icon. Further items appear after pressing the enter key after text to create a new line.
Sub-lists can be created after pressing “enter” to create a new list item. After creating a new line, press the “tab” key to start a sub-list. The list hierarchy is automatically maintained. Sub-lists can also contain their own sub-lists.
To return to the parent list, first create a new line in the current sub-list. On the new, empty line, hold the “shift” key, then press the “tab” key to end the sub-list and go back to the parent list. To end a list, first return to the root list, create a new, empty line, then press “enter” on the empty line.
Other Components

These icons will insert different types of elements into the tab content.
Image:
Upload an image to insert into the lab.
Table:
Insert a table. Include the number of rows and columns, a row and/or column header, and a caption for the table.
Insert a row or column:
Right click on the row or column next to where the new one will go, hover over “Row” or “Column”, then choose whether to insert the new row or column before or after the current one.
Delete a table row or column:
Right click the row or column to be deleted, hover over “Row” or “Column”, then choose “Delete”.
Merge 2 cells:
Right click the leftmost or topmost cell, hover over “Cell”, and click “Merge Cell Right” or “Merge Cell Down”.
Merge more than 2 cells at once:
Click and drag to select all the cells to be merged, right click on one cell, hover over “Cell” and choose “Merge Cells”.
Split a cell:
Right click on the cell, hover over “Cell”, and choose “Split Cell Horizontally” or “Split Cell Vertically”.
Format a cell:
Right click a cell, hover over “Cell”, and choose “Cell Properties”. This shows a menu with many text formatting options.
Modifying the Caption:
Once the table is created, you can edit the caption as if it were text. Other than the table number, you can remove the caption, and even replace it with another component like an info box or student input if the assignment requires them labelling their own table.
Equation:
This function is used to insert an equation. The equation editor uses LaTeX formatting and features various tools to present text. Equations can also be edited by manually writing in the text box. LaTeX uses a type of markup language to construct formatted text. Most markup tags start with a backslash character () and are followed immediately with an identifier to specify the formatting type. Some tags will start with other characters, such as the caret (^) or the underscore (_). Special characters such as ∑, ∆, ∩, e.t.c. are written by adding their identifier after the backslash (\sum, \Delta, \bigcap). Custom text is written by starting with a formatting tag and writing text between the curly braces - {}. Example: “\mathbf{exampleText}” will produce “exampleText”. Spaces in the equation editor do not show up in the text. To force a space, type a backslash () followed by a space. Example: "\ " will produce a space in the LaTeX output.
Link:
Insert a link to a webpage or upload a file for use in the lab.
Reference:
Insert a reference to a source or external resource. This creates text that is smaller than the default in OCLaRE. Note that this does not add a reference to the Overview section, and the references inserted this way are not automatically numbered.
Infobox:
Insert a small, custom section within a tab. This section has most of the components from the regular tab content available, including inputs and computed fields. An infobox will show as a clickable link in the student interface. A student can click on the infobox to show a pop-up window over the regular content. This can be used to add information which doesn’t necessarily need to be shown with the main content.
Student Input and Computed Field

The Student Input is a special field where students will record their data from the experiment. This element has several customizable properties, visible in the “Definition”, “Validation”, and “Notebook” tabs. In addition, these fields can be read in other parts of the lab using an identifier specified in the field’s properties.
Definition:
The “Variable Name” property will create an ID for this input, and “Field Type” will determine what data it will contain. An ID is necessary if the value of this input will be used in another part of the lab. Checking “Required” will make it mandatory for the student to input data. To save the variable name, press the “enter” key after writing the name.
Validation:
This tab will set a range of values that define a valid input. Use this field when the Field Type is set to “Number”.
Notebook:
The notebook allows you to add relevant information to a field for students to view by double clicking the field. Such info might include an explanation of validation, or an explanation of how to calculate the field.
Computed Field:
The Computed Fields function allow calculations to be performed and displayed based on multiple student input fields. To compute data, write an equation using student input variable names and the available operators. The R programming language is available in computed fields. To use R, preface the input with “R(“, and end it with “)”. Note that student input variables must be written in all lowercase letters, and computed field variables must be written in all uppercase letters. you can read more about how to implement Computed Fields at the doc page.
Plot

Plot will generate a graph to place within the lab report. Making a graph requires using the R programming language. Plots can take data from Student Inputs and class data using specific variables.
-
Student inputs use the variable ‘.’ - the period character represents a dictionary of all inputs. To use a student input, use the variable name specified when creating the input.
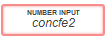
Example:
To use this input in a plot, call it by typing “.$concfe2”.
-
Class data use the variable ‘..’ - two period characters represent a dictionary of all class data. Class data variables are presented as a data frame in R. R functions that require single values will not work with class data, since a data frame is a list of values. To use class data, use the variable name specified when creating the computed field.
To use this computed field in a plot, call it by typing “..$concfe1”. Note that the variable in the R source is lowercase, even though the computed field variable is in uppercase.

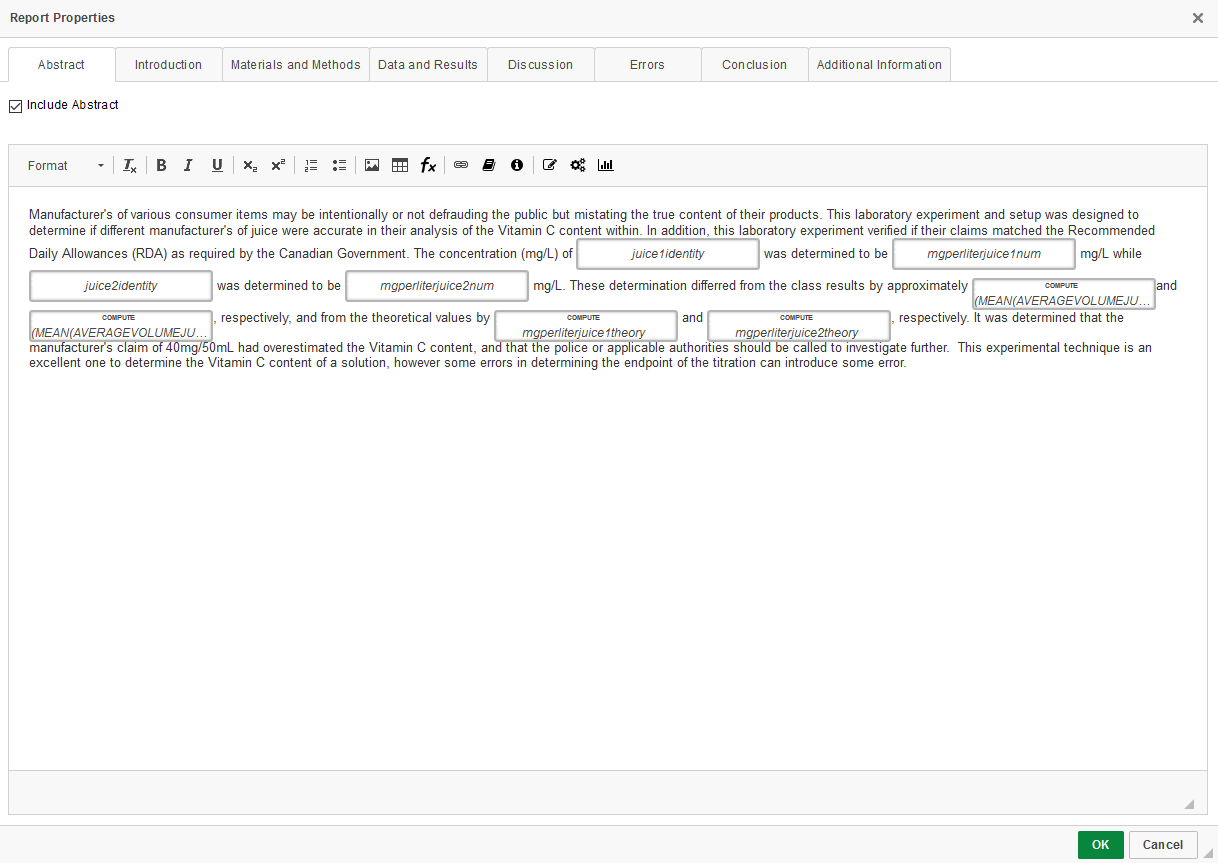
Report

Report is a specialized component for use when generating the final, complete lab report. It should only be used in the Report section of the lab.
Here is where the output of the report can be finalized. Additionally, it allows the addition of an abstract at the beginning of the report.
Hot-Keys
The following shortcuts work in any editor window to modify or add features:
CTRL+BBoldCTRL+IitalicsCTRL+UUnderlineCTRL+1Heading 1CTRL+2Heading 2CTRL+3Heading 3CTRL+4Heading 4CTRL+5Heading 5CTRL+6Heading 6CTR+SHIFT+.SuperscriptCTRL+SHIFT+,SubscriptCTRL+ATL+BReferenceCTRL+ALT+LLeft AlignCTRL+ALT+RRight AlignCTRL+ALT+ECenterCTRL+ALT+JJustifyCTRL+ALT+IStudent InputCTRL+ALT+OComputed OutputCTRL+ALT+PPlotCTRL+ALT+FFunctionCTRL+ALT+TTable